
📚 My Bookmarks
No bookmarks yet
Use the chapter navigation to jump around this report.
Financial Infrastructure Investment Map
From Ratings, Indexes, and Exchanges to Payments, Custody, and Stablecoins: Fee Rights, Cyclical Elasticity, and Valuation Traps
Analysis Date: 2026-07-20 · Data Cutoff: 2026-07
Chapter 1: Executive Summary
The most counterintuitive aspect of this industry is that a “deep moat” and “stable revenue” are not the same thing, “higher rates are beneficial” and “profits rise” are not the same thing, and “profit growth” and “shareholder return” are even further apart. A rating agency with a near-monopoly position can swing from zero growth to double-digit growth within a single year; at a stablecoin company widely regarded as a beneficiary of high interest rates, higher rates can instead shrink circulation; and a company with unremarkable growth can use sustained repurchases to compound per-share value far faster than its growth rate. Treating these companies as a single sector to buy and sell is almost certain to produce the wrong conclusion.
Distinguishing among them requires a toolkit capable of breaking each business down to its foundations. The toolkit used in this report consists of three layers (Figure 1): the control point explains why customers cannot do without the company, the profit engine explains the unit on which it charges, and the macro factor load explains what causes its profits to fluctuate. The three layers are applied by separating first and combining afterward: first break a company down into “what type of control point it owns, which profit engines it operates, and which macro variables it is sensitive to,” and then combine those elements to form a judgment. The same decomposition applies equally well to any new company that has not previously been studied.
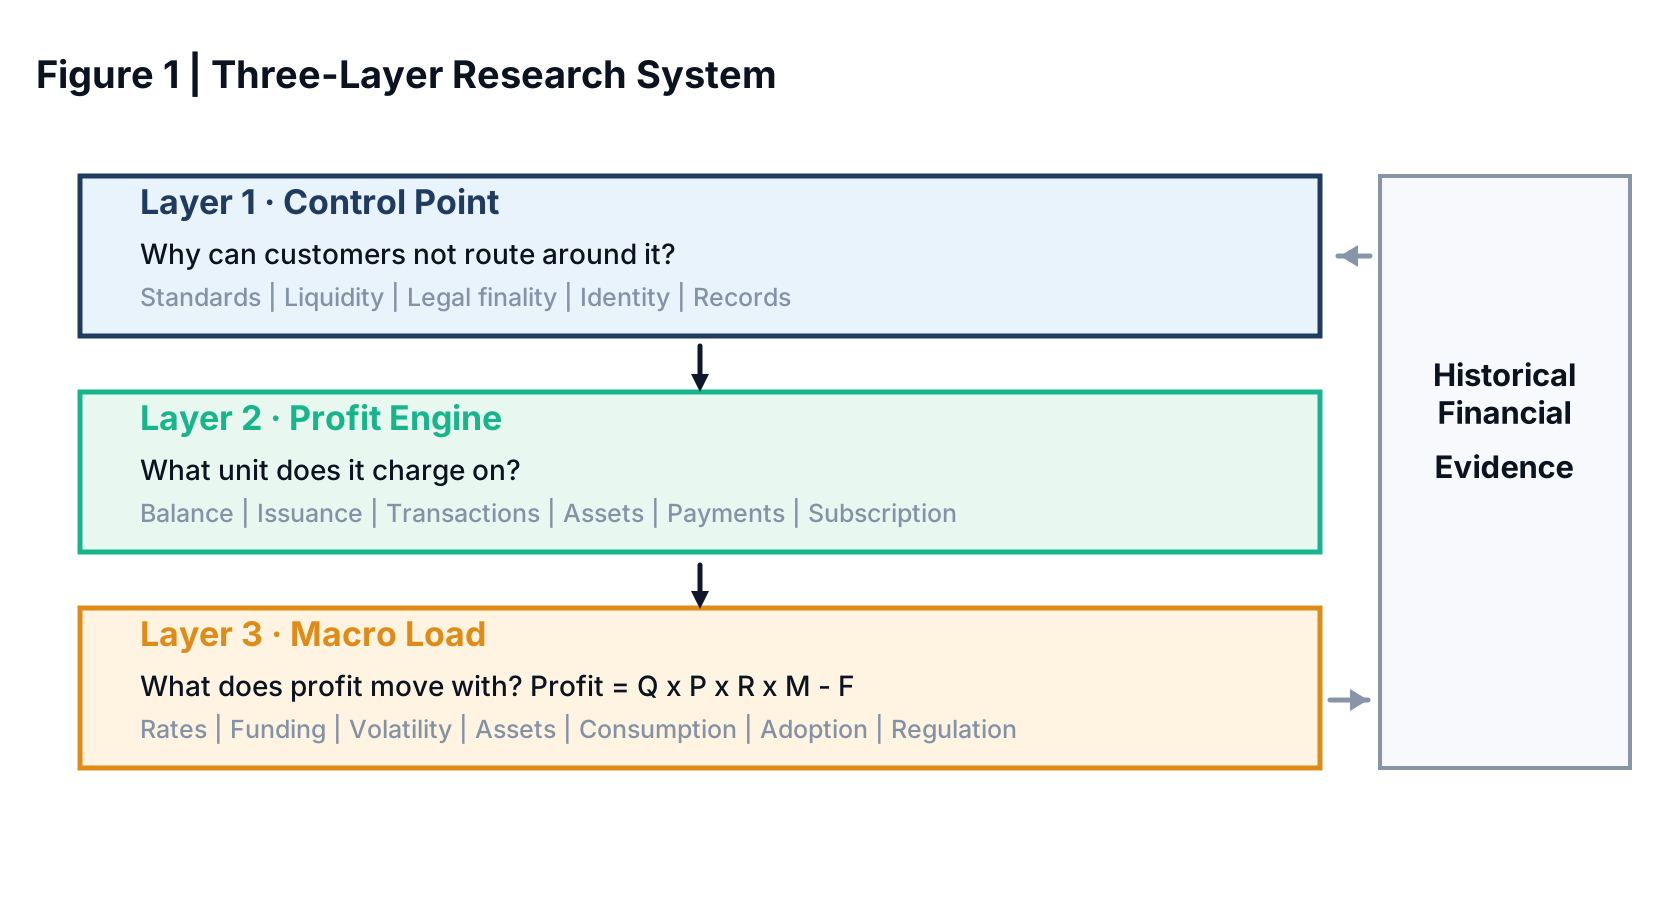
Several conclusions derived from the three-layer framework run throughout this report. Profit equals volume multiplied by unit price multiplied by retention rate, while a single macro variable often affects all three components simultaneously—and in opposite directions. Higher interest rates allow Circle to earn more on each dollar of reserves, while also raising the opportunity cost of holding the stablecoin and reducing its circulation, so final profits may not increase. Even the same decline in revenue can carry vastly different implications: lower debt issuance usually recovers with the cycle, a lower fee rate indicates weakening unit economics, while “contracts and regulations no longer require customers to use the service” means the fee right itself has been undermined. Investors must first determine where the damage has occurred before deciding whether to reduce current-period earnings estimates or reassess long-term value. A single company often contains several profit engines moving in opposite directions: ICE’s transaction business welcomes market volatility, while its mortgage software business welcomes lower interest rates. Applying one broad multiple to the entire group is equivalent to pretending that these businesses move in lockstep. As for AI and asset tokenization, they will not overturn this industry, but they will change how profits are distributed along the value chain: seats for data terminals and manual back-office processing are becoming cheaper, while rating, indexing, and clearing-guarantee functions that “can be cited and have someone accountable when errors occur” are becoming more valuable.
This framework follows the chain from revenue all the way to the investment decision. After revenue, there are three steps. The first asks whether costs move with revenue. At most companies in this industry, costs barely move, so revenue fluctuations are magnified as they flow through to profits. The second asks how earned profits are converted into shareholder return: asset-light standard-setting companies convert profits into repurchases and steadily increase per-share value; capital-regulated, bank-like back offices cannot do the same; and generalists assembled through acquisitions must first prove that their acquisitions have earned back their cost of capital—the efficiency with which the same operating profit reaches shareholders can differ substantially. The third asks how long an external change takes to flow into the financial statements: fast-moving effects appear in the same quarter, while slower ones take two to four quarters.
Assessing the “present” requires three additional yardsticks: whether current profits are above or below normalized levels, whether change is driven by the industry environment or by the company itself, and whether the business is in contraction, bottoming, recovery, expansion, or deceleration. Conclusions for diversified companies are combined based on normalized earnings rather than revenue, while distinguishing between the marginal business that determines future earnings and the business that determines the current valuation. Finally, two separate conclusions are provided for each company: whether the operating environment presents a tailwind or a headwind, and whether the current price already reflects that wind. Getting the first judgment wrong produces losses through the fundamentals; getting the second wrong produces losses through the purchase price.
Beyond the framework, this report also specifically addresses three sources of risk and opportunity that are most easily overlooked. The first is regulation and institutional structure: in this industry, fee rights are almost never destroyed by competition, but by regulatory rewrites—the conflicts of interest in credit ratings, interchange regulation for card networks, the “quasi-regulator” status of index providers, and market-structure reforms affecting exchanges are all manifestations of the same force, with FICO merely the loudest warning at present. The second is capital allocation: for asset-light oligopolies, repurchases are the “seventh profit engine,” contributing a substantial portion of long-term returns while rarely being incorporated into cyclical analysis. The third is operational and systemic resilience: exchange outages, a clearinghouse default waterfall, or a breach of a core system are all low-probability, high-impact tail risks that are scarcely priced in. They are dangerous precisely because they are normally invisible.
Applying this framework to mid-2026 reveals a somewhat contradictory picture. Interest rates remain elevated at 3.5% to 3.75%, rate cuts have paused, and the Federal Reserve has turned hawkish; the issuance window is open, equity markets are near their highs, and policy uncertainty continues to sustain strong hedging demand. The profit engines at most companies are running. Yet precisely because the environment is so favorable, the highest-quality companies are not cheap at present. Historically, the real buying opportunities for standard-setting oligopolies have appeared when debt issuance was frozen, bear markets produced drawdowns, or policy panic took hold; none of the three is present today. The companies more deserving of attention now are therefore those whose revaluation depends on their own execution rather than on correctly predicting the macro environment, as well as liability-bearing back offices that the market has persistently undervalued. Part Five develops this judgment company by company.
Chapter 2: What It Sells Is an Unavoidable Step in Every Transaction
To understand why these companies can charge fees over the long term, first consider an ordinary cross-border payment or a company issuing a bond. For money to move safely from one account to another, or for bonds to pass from the issuer to investors, someone in the middle must perform five functions: establish the shared standards everyone uses (what rating a bond carries, which constituents an index includes, and what format messages follow); bring buyers and sellers together and guarantee that the counterparty will not default; legally confirm who owns the asset at that moment; verify the payer’s identity and authorization; and maintain a complete and accurate record of every account and right without a single day of interruption.
Technology changes, interfaces change, and speed changes, but these five functions cannot disappear. Whoever turns any one of them into an unavoidable step that others cannot bypass earns the right to charge fees over the long term. These five functions correspond to five types of control points.
Chapter 3: Five Types of Control Points Determine How Long Fee Rights Can Be Defended
Control points do not directly generate revenue; they determine how high that revenue can be priced and how many years it can be defended. The five types of control points vary greatly in strength.
The strongest is a common standard: ratings, indexes, and credit scores. Its barrier lies in the fact that replacement requires the entire market to act simultaneously: fund charters state that they “only purchase bonds rated investment grade by two recognized agencies,” regulatory capital rules reference ratings, and countless contracts benchmark against a particular index; any party that switches first on its own incurs costs without gaining benefits, so no one moves. Replacing a standard therefore carries far more weight than a procurement decision: it is an action that changes the market’s common rules. This type of barrier has two other sources: decades of accumulated default data (“how many bonds of this grade default over ten years,” a track record that a newcomer cannot manufacture) and formal regulatory adoption. Its power is written directly into profit margins: Moody’s ratings business is at approximately 66%, MSCI’s index segment at approximately 76%, and FICO’s scoring segment close to 88%. Operating margins like these are exceedingly rare across the entire equity market.
The remaining four types weaken in sequence. Liquidity concentration is self-reinforcing: buyers and sellers congregate in the deepest market, while the open interest and margin efficiency accumulated around flagship contracts cannot be relocated. The legal right of final confirmation derives from sovereign authorization; statutory registration and clearing guarantees cannot be outsourced. Identity and permissions rely on trust networks spanning numerous institutions and a continuous feedback loop of outcome data. Core systems of record, such as banks’ core systems, may not be popular with customers, but the risks of replacement are so great that they would rather tolerate them; this locks in the installed base rather than incremental business, making it the weakest of the five types.
One point must be made explicit first, because it determines the weight of every judgment that follows: among these five types of control points, what is truly impregnable is never the technology, but “who has the authority to replace it.” Technology can be replicated and data can be accumulated anew, but getting “the entire market to switch simultaneously to another standard” requires asset owners, managers, regulators, and counterparties all to agree—the coordination cost itself is the moat. This also means that the force capable of penetrating the moat is likewise not a better product, but a party capable of enforcing coordination: the regulator. This thread will be developed in Chapter 4.
Around this framework, this report puts forward five judgments. Each states the conditions under which it would be invalidated, because being able to articulate clearly where one could be wrong is what separates research from storytelling.
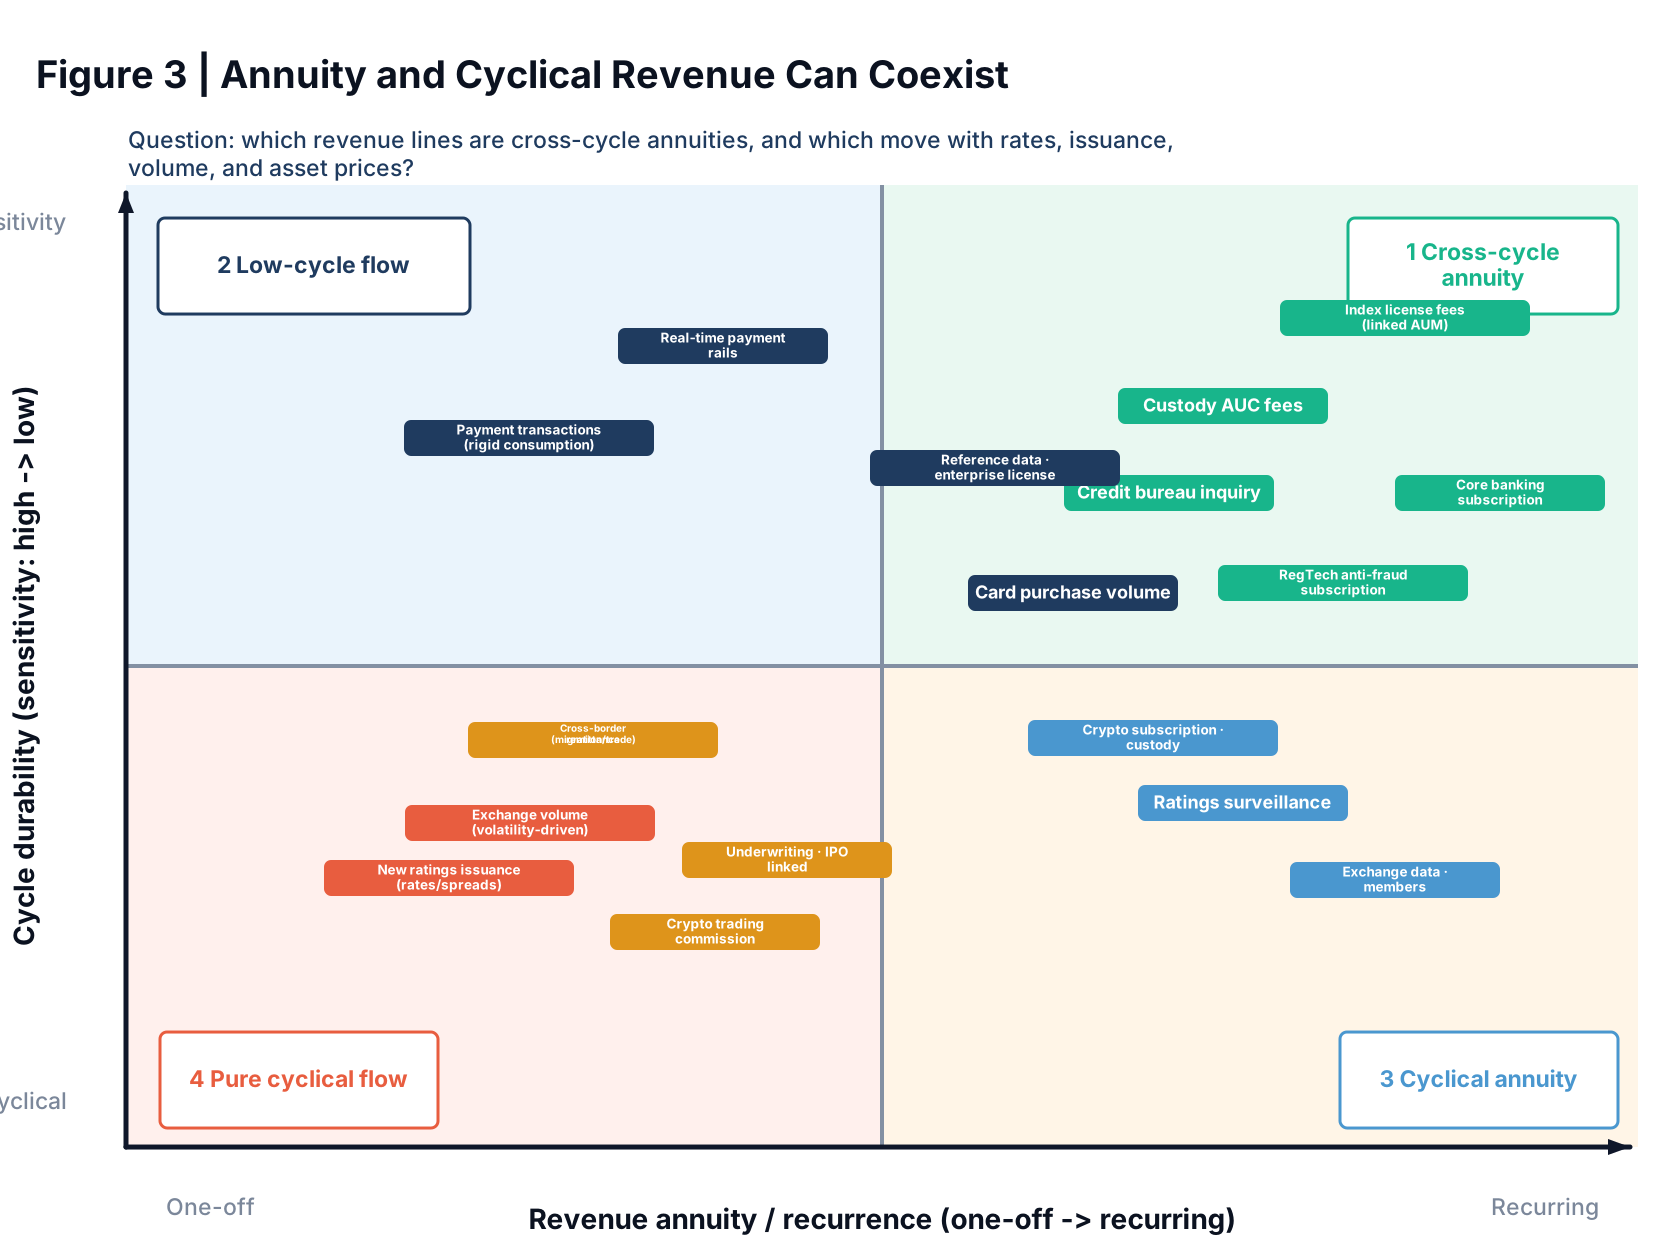
Revenue stability depends on whether customers “must pay” or “are willing to pay,” not on billing frequency. Only revenue mandated by contracts and regulatory references is a true annuity; subscriptions that renew automatically every year but whose seats customers can cut at any time are merely recurring in the accounting sense; fees charged on asset scale, when asset prices fluctuate sharply, are cyclical revenue dressed in annuity clothing. If revenue from mandatory references also contracts sharply during a frozen issuance window, this judgment does not hold. Figure 3 classifies industry revenue by this standard: the lower-right category, “highly cyclical annuities” (new-issuance ratings and crypto subscriptions), looks almost identical to a true annuity in financial statements but is cyclical in substance, making it the type of revenue most easily mispriced across the entire industry.
When standards companies raise prices, they do not lose customers in the short term, but they invite institutional backlash over the long term. Customers will not stop lending because a score rises from five dollars to ten dollars, so short-term volume barely declines; but every price increase raises the probability of regulatory intervention, customers building in-house solutions, or alternative standards receiving coordinated support. Their price elasticity is very low commercially but very high politically. FICO is currently validating this judgment, as detailed in Chapter 17. The real test is this: if a standards company raises prices sharply year after year yet never provokes any backlash, this judgment must be reconsidered.
The direct effect and ultimate effect of a macro factor are often opposite. The direct effect of interest rates on Circle’s unit yield is positive, but higher rates simultaneously constrain circulation, cool the market, and raise the valuation discount rate. Looking only at the first-order effect leads to the wrong conclusion; the aggregate effect must be assessed.
The value of a diversified group depends on whether its businesses complement one another, not on the number of businesses. Complementarity takes two forms: the profit engines move in opposite cyclical directions and hedge one another (ICE), or the businesses share customers and control points and can cross-refer business to one another (Nasdaq). Diversification with neither brings only complexity and a discount.
The impact of new technology unfolds in two sequential steps. It first lowers the price of interfaces and human labor: seat fees for data terminals and processing rates for manual back-office work will come under pressure first; it then raises the price of authorization and accountability: “referenceable” functions such as ratings, indexes, and clearing guarantees will become more valuable, as detailed in Chapter 24. If, after AI has been widely adopted for years, seat fees for data terminals and rates for manual back-office work remain resilient, this judgment should be abandoned.
Chapter 4: Six Profit Engines: Whether Revenue Moves with Balances, Issuance Volume, Trading Volume, or Asset Prices
Control points determine the moat; the unit charged determines the cycle. This industry has only six charging units, corresponding to six profit engines.
| Engine | Charging Basis | Representative Businesses | Key Point |
|---|---|---|---|
| Balance Spread | Average Balance × Interest Spread | Circle, Custodian-Bank Interest Income | High interest rates are beneficial only if balances do not run off |
| Issuance and Financing | Issuance Volume × Fee Rate + Ongoing Surveillance | Ratings, Underwriting, Loan Scoring | Moves with the issuance window, not directly with policy rates |
| Transaction and Clearing | Trading Volume × Net Fee per Transaction | CME, CBOE, ICE Trading | The key is the net fee rate; direction does not matter—movement does |
| Asset Levels | Linked Assets × Revenue Share + Subscriptions | MSCI, Indices, Custody Fees | Watch the level of existing assets, not how many new products are launched |
| Payment Activity | Spending Volume, Transaction Count, Cross-Border Volume | Visa, Mastercard | Moves with nominal spending; interest rates are only an indirect variable |
| Subscription Records | Existing Accounts / Modules × Contract Price | Broadridge, Software, Data | Almost entirely macro-insensitive; the only risk is disintermediation |
Crossing control points with profit engines produces the matrix in Figure 2. Its usefulness lies in this: the matrix’s vertical categories correspond to the sources of the moat and are therefore suitable for assessing how long the fee right can be defended; the horizontal categories correspond to whether revenue moves with balances, issuance volume, trading volume, or asset prices and are therefore suitable for short-term forecasting. Companies with similar moats can be assessed using similar long-term quality criteria, but short-term earnings forecasts must return to each company’s specific charging unit. The market often reverses these two tasks, forecasting revenue based on the moat (“standards companies are all very stable”) while assigning multiples based on the charging unit (“an exchange should trade at this multiple”).
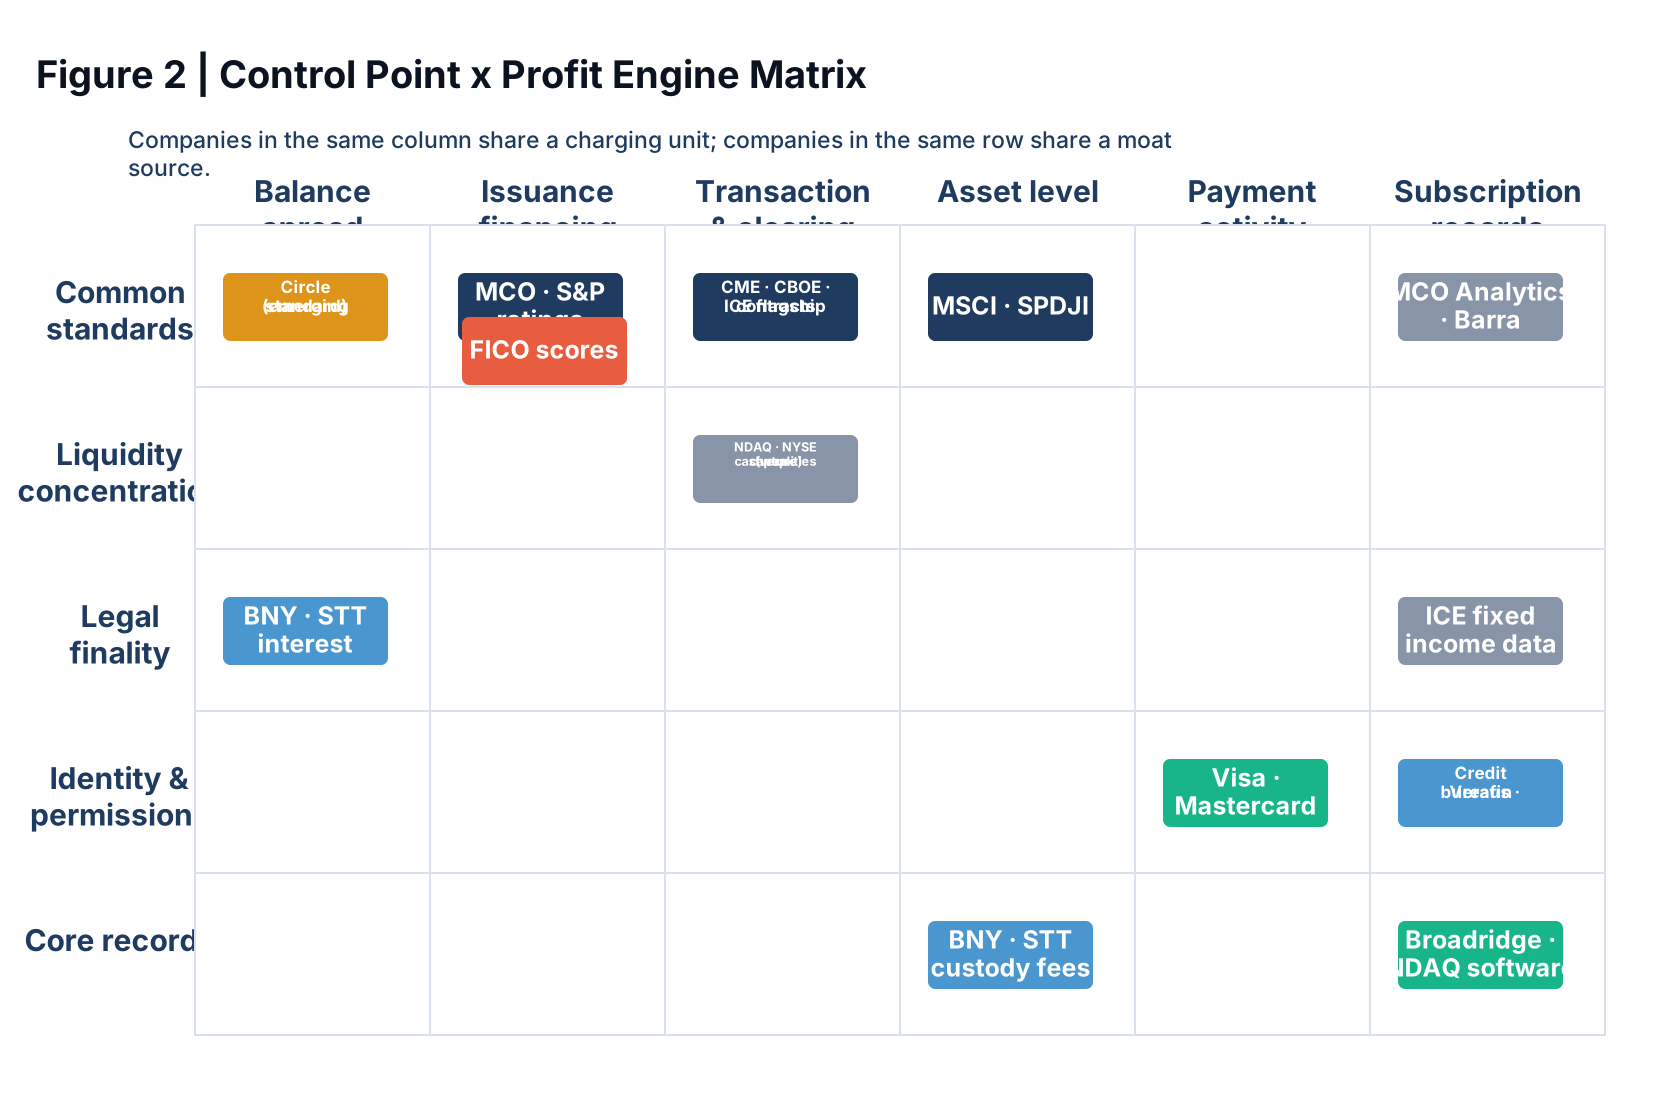
The matrix first clarifies several facts that are often conflated. Moody’s and MSCI are both in the “Common Standard” row but in different columns: their moats share the same source, while their cycles are entirely different. CME and Nasdaq’s cash-equities trading business are both in the “Transaction and Clearing” column but in different rows. Both charge based on trading volume, yet the proportion of each transaction they actually retain differs enormously. BNY and State Street each span two columns because interest income and custody fees are two separate engines, and even the direction of their responses to interest rates differs. FICO and the rating agencies are both in the “Common Standard” row, but its usage volume follows loan-origination volume, placing it in the Issuance and Financing column. Meanwhile, all the controversy currently surrounding FICO is occurring along the row dimension: its fee right is being challenged, making the column dimension comparatively secondary.
The matrix also accommodates several names that this report does not examine separately but that readers will encounter sooner or later. Fitch occupies the same ratings cell as S&P and Moody’s. It is the privately held third party among the “Big Three rating agencies,” and its presence precisely defines the boundary of the duopoly’s pricing power (Chapter 15). FTSE Russell (part of London Stock Exchange Group) and Bloomberg Indices share the same column as MSCI and S&P Dow Jones Indices, representing the other two poles in the index business’s market-share contest. DTCC and SWIFT sit in the “Legal Confirmation / Core Records” area. Although unlisted, they are deeply entrenched clearing and messaging hubs. Place any new name on this matrix and first ask which row and column it belongs in; that immediately reveals which framework to use for assessing its moat and which charging unit to monitor—precisely the matrix’s value as a tool.