
📚 My Bookmarks
No bookmarks yet
Use the chapter navigation to jump around this report.
Next-Generation AI Data Center Power Delivery System
A Complete Supply-Chain Breakdown from Grid to GPU
Analysis Date: 2026-07-20 · Data Cutoff: 2026-07-10
Chapter 1: Executive Summary
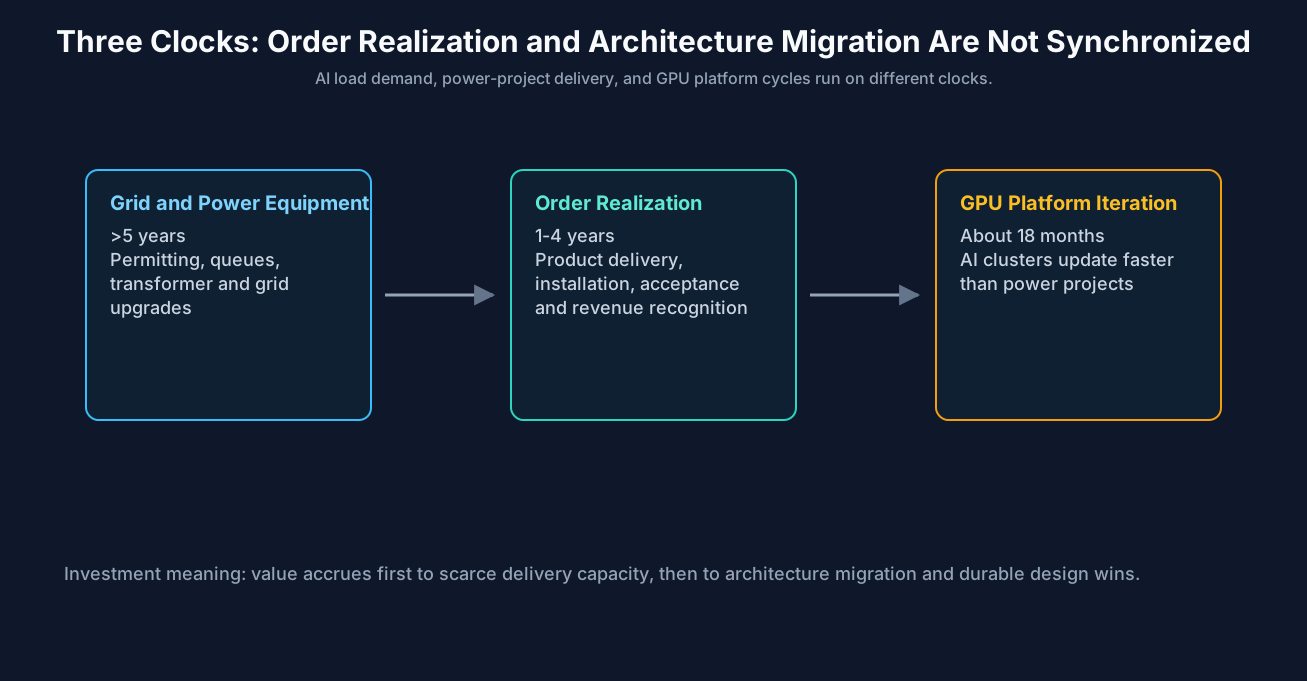
The power system is simultaneously undergoing “grid expansion” and “rack voltage escalation,” but the timelines of these two shifts are not aligned; capital markets have already begun pricing the gap between them.
An AI data center is an industrial facility whose output is computing. Beyond GPUs, it also requires continuous, scalable, and dispatchable power at the target location. Electrical systems were once treated as a back-end cost, but they now affect whether projects can begin construction on schedule, whether racks can operate at full load, and whether training workloads can run continuously.
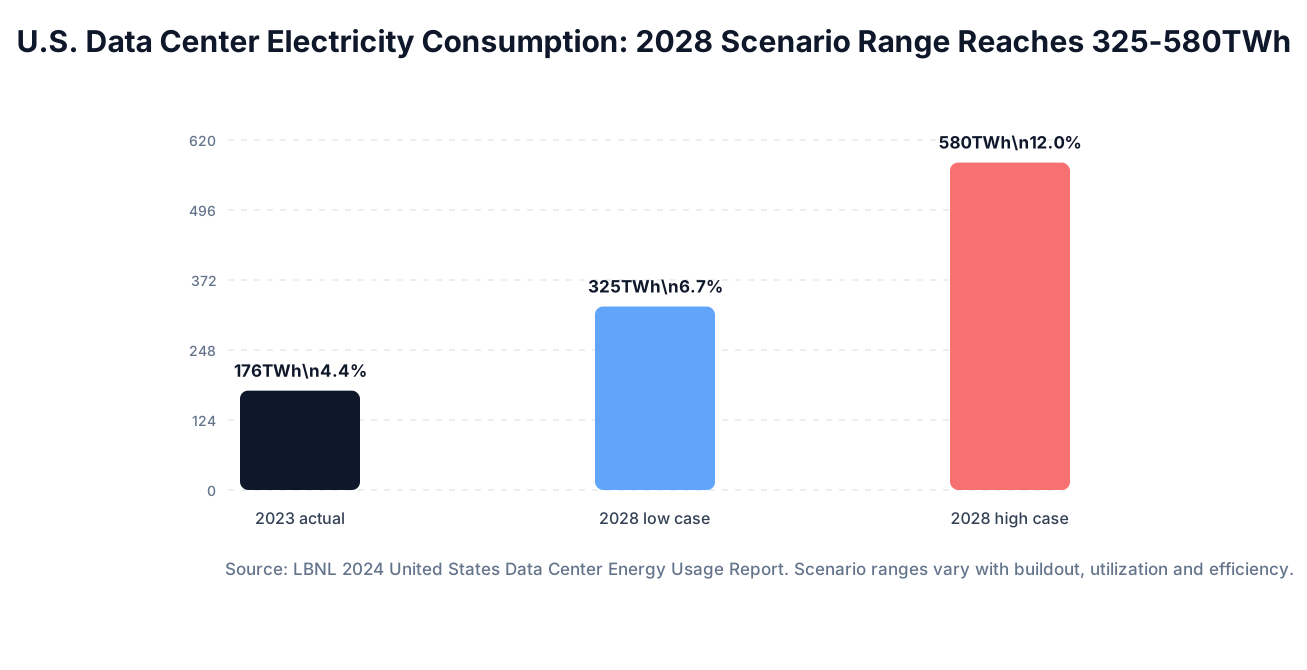
| >5 years / Median period from application to commercial operation for projects entering service in 2025 / GPU platforms iterate approximately every 18 months, while power projects take at least about 3.5 years longer | 176TWh U.S. data center electricity consumption in 2023 4.4% of nationwide electricity consumption; 2028 scenario: 325–580TWh(6.7%–12.0%) |
$333.44/MW·day / PJM 2027/28 capacity auction price / Approximately 11.5 times the 2024/25 level, while procurement volume remained below the reliability target |
|---|---|---|
| >2,060GW Active U.S. grid interconnection queue as of the end of 2025 Queue capacity does not equal deliverable supply(historical completion rate of approximately 13%) |
800VDC NVIDIA’s next-generation high-density rack roadmap The official baseline points to Kyber in 2027; current for 1MW falls from 18,519A to 1,250A |
~30% Conversion, distribution, and cooling consumption of input power at an AI factory Approximately 300MW for a 1GW campus; a 1% loss equals 10MW |
Ten Conclusions
- U.S. electricity demand has entered a new upward cycle, but data centers are only one of the drivers. Manufacturing reshoring, transportation and building electrification, and extreme weather also affect load. Data center research must look beyond project announcements to regional power availability, transmission constraints, and cost allocation.
- Grid interconnection queues, gas-turbine production slots, and the drying and testing cycles of large transformers cannot be shortened immediately with capital. Power-equipment companies are still selling scarce delivery capacity, and customers are willing to pay for earlier equipment delivery. Over the past year, the share prices of relevant companies have not simply ranked according to the severity of shortages; delivery advantages are more likely to receive sustained market recognition only when they translate into pricing, advance payments, revenue, and cash per share.
- Segments with relatively strong order visibility over the next two years include transformers, medium-voltage switchgear, protection systems, prefabricated electrical modules, on-site generation, energy storage, and engineering construction. Lead times, certifications, installation capabilities, and service networks constitute tangible advantages for these products.
- 800V primarily addresses the high-current problem. 1MW requires approximately 18,519A at 54V and approximately 1,250A at 800V. Raising voltage can reduce requirements for copper, physical volume, and conductor-loss management, while increasing requirements for shock protection, arc protection, insulation, DC protection, and maintenance safety. The electric-vehicle industry has already established a high-voltage component supply chain, lowering the adoption threshold; data centers must still balance current, insulation protection, maintenance, and total system cost.
- New high-density projects are redistributing the functions of UPS systems, DC busways, distributed backup power, and BESS. In-rack energy storage is a new component introduced only in the past two product generations. By smoothing instantaneous peaks, it improves utilization of existing grid connection capacity and distribution equipment while reducing some redundancy provisioned for instantaneous peak demand; it cannot reduce sustained electricity demand or replace grid interconnection and substation construction.
- NVIDIA has incorporated 800VDC into its next-generation roadmap and organized a multi-vendor ecosystem spanning chips, components, and facility power systems. A defined roadmap improves industry visibility, but it also means that multi-sourcing and open standards will weaken the long-term pricing power of any single component. Inclusion on the list proves “entry into the ecosystem,” not market share or gross margin; price-to-sales ratios can differ by an order of magnitude among companies on the same partner list.
- The ability to operate safely for many years and retain design wins across generations determines how much profit system and component suppliers can preserve. Protection selectivity, grounding, partial discharge, control stability, liquid-cooling coordination, testing and certification, and accident liability influence customer selection more than laboratory peak efficiency. Materials and manufacturing processes, design wins, and the supply structure determine whether growth in component content can translate into profit.
- Lead-time barriers, certification, and capacity bottlenecks can improve order visibility, but they cannot independently explain share-price performance. A comparison of 32 valid samples shows that the rank correlation between bottleneck depth and share-price returns over the past year was approximately -0.33, versus approximately +0.22 over three years. The share of the relevant business within the company, the time required for orders to become cash, and the starting valuation all affect the returns ultimately received by shareholders.[14]
- In cross-sectional comparisons, higher ROA and a shorter CCC generally support higher valuations; when examining share-price performance over the past year, the market has been more sensitive to the pace of improvement in operating efficiency than to simply rewarding the starting level. Within the sample, the rank correlation between a shorter adjusted CCC and one-year returns was approximately -0.51, while the correlation between improvement in return on operating assets and returns was approximately +0.40. Earnings forecasts are more likely to be revised upward when the conversion of orders into revenue and cash accelerates.[14]
- Industry bottlenecks can only explain demand and supply; they cannot independently explain stock returns. Vertiv, GE Vernova, and Monolithic Power Systems have already provided evidence through revenue, profit, or cash, but their valuations also require growth to persist. Market expectations for Navitas and Bloom Energy are clearly running ahead of cash realization. Current cash flows at Vistra and Constellation are easier to verify, while their long-term value depends on contracts, electricity prices, and regulatory rules.
Source: Compiled from the aforementioned materials.
Construction sequence and investment implications: The long-term technology direction is to raise voltage, adopt DC earlier, and strengthen protection. In the near term, construction must still begin by securing power, then delivering it into the building, followed by upgrades to rack power and board-level power delivery. The investment value of each segment depends on delivery timing, design wins, cash conversion, and current valuation.
Chapter 2: Introduction: Time Lags, Profit Allocation, and Shareholder Returns
A new generation of GPUs is introduced approximately every 18 months. Berkeley Lab statistics for projects entering service in 2025 show that the median time from application to commercial operation for U.S. power-generation projects has exceeded five years, creating a gap of at least approximately 3.5 years. AI data centers increase electricity demand, but generation, transmission, and grid interconnection cannot expand at the pace of GPU development. This waiting period has increased the value of existing grid-connected capacity and equipment that can be delivered on schedule.[3]
Hyperscale cloud companies can purchase land and GPUs and sign power purchase agreements, but they cannot immediately secure a position near the front of the grid-interconnection queue, obtain production slots for gas turbines that are already fully booked, or shorten the drying and testing cycle for large transformers. By 2026, data centers are purchasing both kilowatt-hours and reliable delivery dates.
Electricity Begins to Be Lost Before It Reaches the GPU
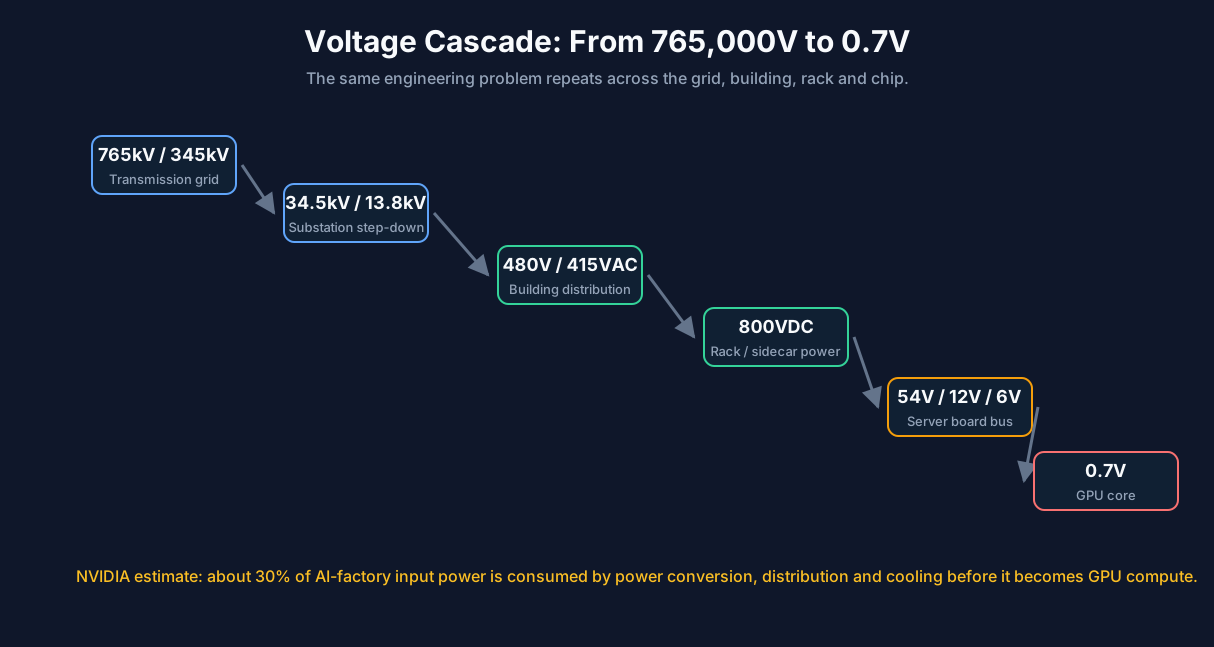
Power plants transmit electricity at extremely high voltages. The highest-voltage transmission lines in the United States can operate at 765,000 volts; at the other end of the power-supply path, a transistor’s switching voltage is less than 1 volt, approximately 0.7 volts. Such an enormous voltage reduction is necessary because transmission losses are primarily determined by current: for the same amount of power, higher voltage means lower current and less energy lost as heat. Voltage is therefore changed progressively through the grid, data-center electrical rooms, racks, circuit boards, and chip packages. As equipment scales continue to shrink, the engineering task remains the same: control voltage and reduce heat losses.
Source: Compiled from publicly available technical materials; loss estimates are drawn from NVIDIA’s discussion of the Rubin platform.
This physical process involves significant losses. NVIDIA estimates that approximately 30% of the electricity entering an AI factory is consumed by power conversion, distribution, and cooling systems before it can be converted into GPU computing. In a 1GW data center, this means approximately 300MW of power is used to sustain the process of delivering electricity to computing equipment. Most losses from power conversion ultimately become heat, and dissipating that heat requires still more electricity.[10]
Simply increasing power generation cannot eliminate transmission, conversion, and cooling losses. For a 1GW data center, a 1% loss equals 10MW, roughly equivalent to the output of a small generator. Existing power-supply systems were never designed for this level of load density or pace of change. While expanding generation capacity, the entire path through which electricity reaches the GPU must also be upgraded.
Technology and delivery: The amount of electricity lost along the path determines technology choices involving higher voltages, conversion to direct current, and fewer conversion stages. When equipment can be delivered determines orders, pricing, and valuation. The two are beginning to collide directly in the long-established 48V rack-power standard.
How the Market Prices Four Types of Businesses
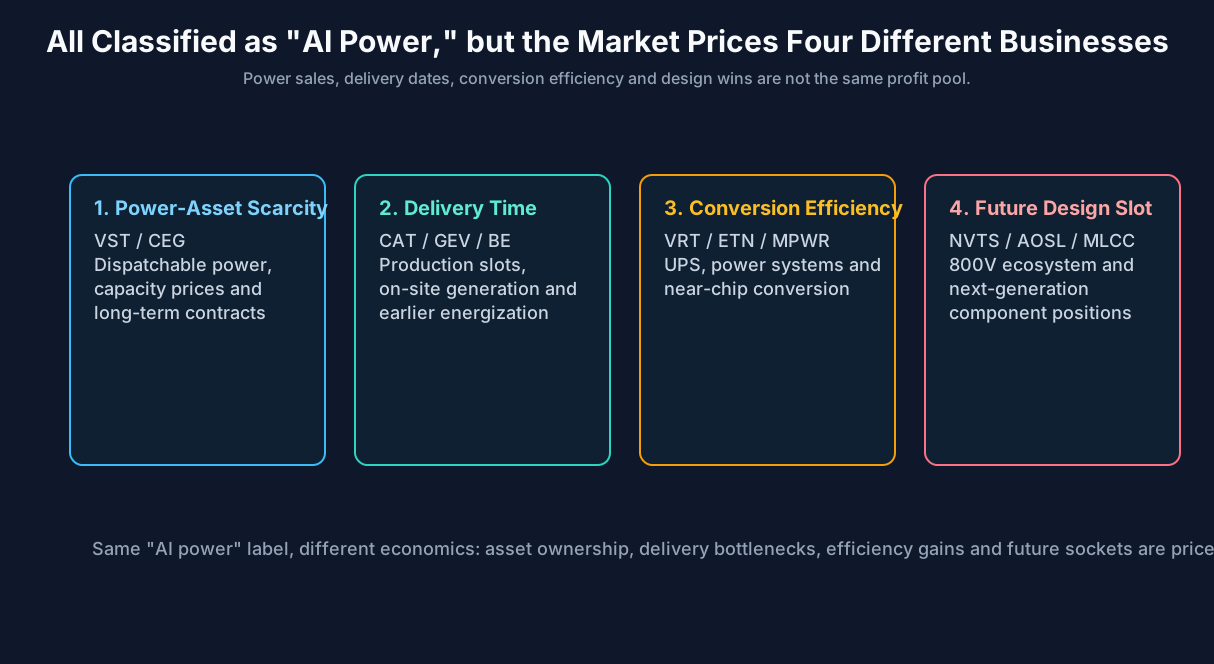
Power shortages first increase the value of capacity, yet the companies with the largest share-price gains over the past year have been concentrated primarily in equipment, systems, and components. The market’s valuation changes for delivery speed, conversion efficiency, and next-generation design slots have exceeded the repricing of electricity-sales revenue itself.
The scarcity premium in regulated power markets has already reached its ceiling; Chapter 1 presents the PJM capacity-price series. Over the past year, Caterpillar (CAT), GE Vernova (GEV), Bloom Energy (BE), Vertiv (VRT), Eaton (ETN), Monolithic Power Systems (MPWR), and Murata Manufacturing (6981.T), among others, have posted larger gains. They help customers obtain power sooner, reduce transmission and conversion losses, or move power conversion closer to the GPU.
Revenue at Vistra (VST) and Constellation Energy (CEG) continues to grow, but their valuation changes have been relatively limited. Navitas Semiconductor (NVTS) provides another contrast: revenue declined by approximately 45%, yet its share price rose because of the expected value of the 800V technology roadmap. The market prices electricity-sales contracts, delivery times, conversion efficiency, and future design slots separately, creating clear divergence among companies that all fall under the “AI power” theme.
Source: Compiled from publicly available market information; valuation multiples are illustrative ranges, not real-time data.
Delivery times, scarcity premiums, customer prepayments, and future design slots jointly determine corporate value. When evaluating a company, investors must first determine its position in the power-supply system, why customers pay it, how long orders take to turn into cash, and how much growth is already embedded in the current valuation.
How Industry Bottlenecks Become Cash Per Share
The previous two sections explain why customers are willing to pay for delivery time. Equity investors must also ask how quickly a company can convert this scarcity into cash per share and how much growth is already embedded in the current valuation. Customers wait for equipment, shareholders wait for cash, and the market may price future revenue years in advance. Equipment companies with very long lead times and component companies with very high valuations can both produce outcomes in which the industry thesis is correct but shareholder returns remain limited.
The sample includes ten focus companies and is expanded to 32 companies. Historical prices, point-in-time financial statements, and valuation data come from FMP; key cases including VRT, GEV, BE, CAT, and MPWR were cross-checked against annual reports or 10-K filings. Correlations within the sample show only how the market ranked companies during this period and should not be treated as long-term causal relationships.[14]–[19]
This dataset does not show that the deeper a bottleneck, the stronger the share-price performance over the past year. Companies with higher initial operating margins and returns on operating assets actually tended to produce lower one-year returns. The past year was a period of rapidly spreading expectations around AI power, and companies such as BE and NVTS received valuation uplifts for future technology roadmaps and growth options; some mature companies already had relatively high starting valuations, and their share prices tracked current-period profit growth more closely. This reflects starting valuations and the market cycle, not that lower efficiency is more valuable.
Operating efficiency still affects valuation levels. The rank correlation between current EV/EBITDA and ROIC is approximately +0.46, while that between current P/S and ROA is approximately +0.38. The more significantly adjusted CCC shortened within one year and the faster the return on operating assets improved, the stronger share-price performance generally was. Operating quality supports valuation, while operating improvement is more likely to drive upward revisions to earnings forecasts.
Sample Comparison: Operating Growth and Valuation Changes Jointly Determine Share-Price Performance
| Company | One-Year Return | Change in P/S | Change in Revenue/Share |
|---|---|---|---|
| BE | +863% | 4.0x → 34.0x | +30% |
| VRT | +159% | 5.9x → 11.9x | +26% |
| CAT | +137% | 2.9x → 6.5x | +9% |
| NVTS | +131% | 14.9x → 65.2x | -51% |
| GEV | +103% | 4.2x → 7.7x | +10% |
| MPWR | +85% | 16.0x → 23.8x | +28% |
| ETN | +14% | 5.6x → 5.8x | +13% |
| VST | -19% | 3.4x → 3.2x | -9% |
| CEG | -21% | 4.3x → 3.5x | +9% |
VRT, GEV, and MPWR benefited from both operating growth and valuation expansion; ETN’s multiple was nearly unchanged, and its share price primarily tracked growth in revenue per share. Share-price gains at BE and NVTS far exceeded changes in current-period revenue per share, as investors were paying for future technology roadmaps and revenue potential. VST and CEG own scarce power assets, but their earnings leverage and valuation changes remain constrained by regulation, contract structures, and capital expenditures. The correlation between changes in P/S and share prices is high, but it contains a mathematically shared component and therefore cannot be used to infer causality.[14]
How much shareholder value a particular industry bottleneck can create depends on the relevant business’s share of the company, pricing power, delivery speed, gross-margin retention, cash conversion, value retained per share, and the current valuation.
Chapter 3: U.S. Power Infrastructure: Demand, Supply, and Grid Interconnection
The first bottleneck for a data center is not inside the facility, but whether the regional grid has available capacity.
3.1 Data Center Electricity Demand Evolves from a Local Issue into a National Variable
Lawrence Berkeley National Laboratory estimates that U.S. data centers consumed approximately 176TWh of electricity in 2023, accounting for 4.4% of national electricity consumption; under different construction and efficiency scenarios, consumption could reach 325–580TWh by 2028, representing 6.7%–12.0%. This range will vary with server shipments, utilization rates, cooling efficiency, workload types, and project schedules.[1]
Incremental data center load has begun to collide directly with regional generation, transmission, and substation construction cycles. A campus with several hundred megawatts of capacity is sufficient to reshape local peak demand, capacity markets, transmission expansion plans, and discussions about residential electricity rates.
Source: LBNL, 2024 United States Data Center Energy Usage Report.[1]
3.2 U.S. Total Electricity Consumption Continues to Rise, with the Commercial Sector Emerging as the Most Visible Source of Incremental Demand
The EIA’s July 2026 Short-Term Energy Outlook projects that total U.S. electricity consumption will increase from 4,195TWh in 2025 to 4,269TWh in 2026 and 4,399TWh in 2027. Commercial electricity sales are expected to exceed residential electricity sales for the first time in 2026, with the gap widening to approximately 96TWh in 2027.[2]
Part of the increase in commercial electricity consumption comes from data centers, while demand from large commercial facilities, service industries, climate-related loads, and other electrification needs is also growing. What makes data centers distinctive is their rapid growth, geographic concentration, and highly volatile load profiles.
3.3 New Load Will Not Be Met by a Single Power Source
The EIA expects natural gas to remain the leading source of U.S. electricity generation in 2027, with nuclear, coal, wind, solar, and hydropower all contributing. Data centers require available electricity every hour, so regional grids must provide both sufficient annual energy and adequate peak output, transmission deliverability, and contingency reserves.[2]
Capacity indicates maximum output; energy indicates the ability to sustain power delivery
A 1GW power plant indicates only its maximum output, not how much electricity it can generate in a year; a 100MW/400MWh battery can discharge at 100MW for approximately four hours, but it cannot provide continuous power for an entire day. For data centers operating 24×7, the power-supply mix must simultaneously satisfy requirements for power, duration, ramp rate, and contingency reserves.
3.4 PJM Has Embedded Regional Tightness into Capacity Prices
PJM’s capacity market procures available generation capacity in advance for future delivery years. Its benchmark price surged from $28.92/MW-day for the 2024/25 delivery year to $269.92 for 2025/26, $329.17 for 2026/27, and $333.44 for 2027/28. Prices in the latest auction were constrained by cap rules, while procurement still fell approximately 6.6GW short of the reliability target.[5]
Capacity prices reflect load forecasts, generator retirements, new supply, auction rules, and reliability standards, and are not equivalent to residential electricity rates or data center electricity prices. PJM prices reaching the regulatory cap indicates that available capacity in the U.S. Mid-Atlantic region has already generated a monetizable scarcity signal. Capacity-market premiums are constrained by market rules, but equipment lead times, grid interconnection schedules, and contractual performance capabilities can still be reflected in equipment pricing and project terms.
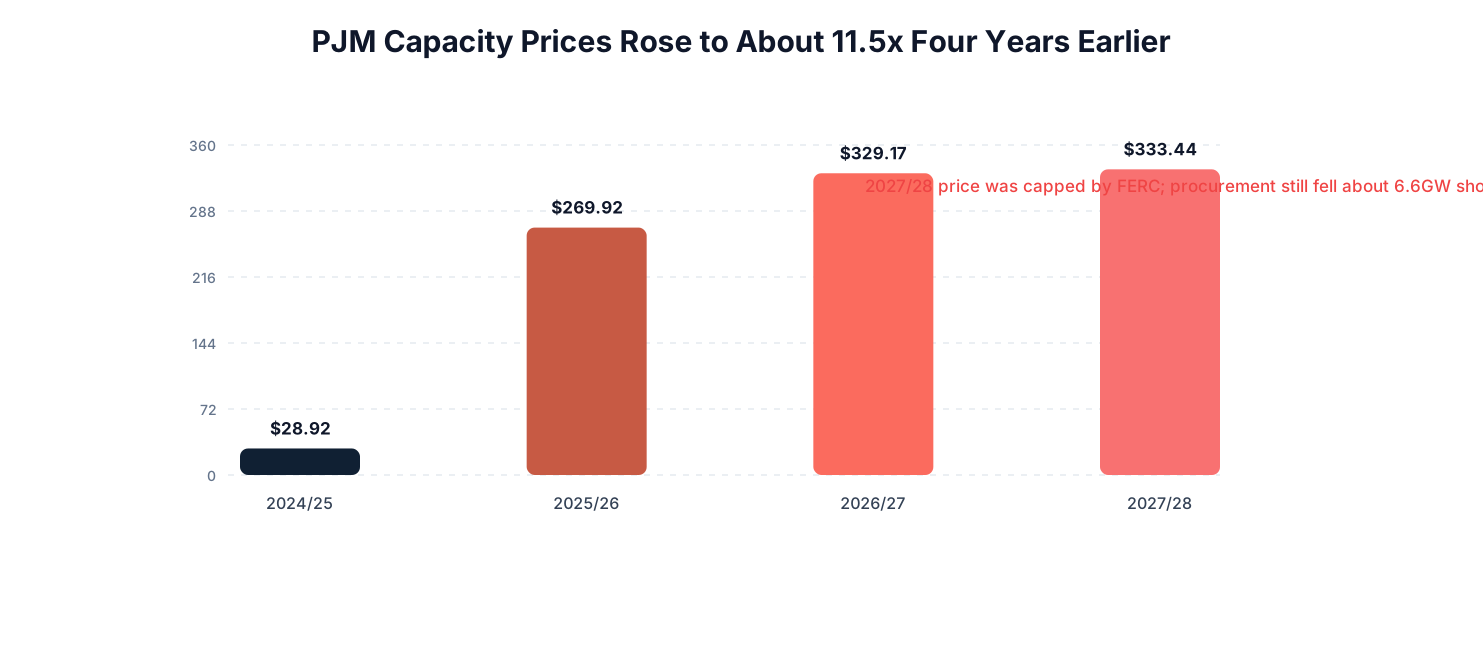
Source: Publicly disclosed PJM capacity-market results; relevant Reuters reporting from 2024–2026.[5]
3.5 The Grid Interconnection Queue Is Large, but It Cannot Be Treated as a Future Supply List
As of the end of 2025, active U.S. grid interconnection queues exceeded 2,060GW, comprising approximately 1,312GW of generation and 749GW of energy storage across approximately 8,200 projects. Meanwhile, for projects that entered operation in 2025, the median time from application to commercial operation had exceeded five years; looking back at capacity applications submitted from 2000 to 2020, only approximately 13% had ultimately entered operation by the end of 2025.[3]
A grid interconnection queue exceeding two terawatts does not mean that all these projects can enter operation soon. Projects may submit duplicate applications, change locations, lack equipment, fail to secure land or financing, or stall at the network-upgrade and permitting stages. Regional power-supply capacity should be assessed in conjunction with executed grid interconnection agreements, network-upgrade payments, long-lead equipment orders, and construction milestones.
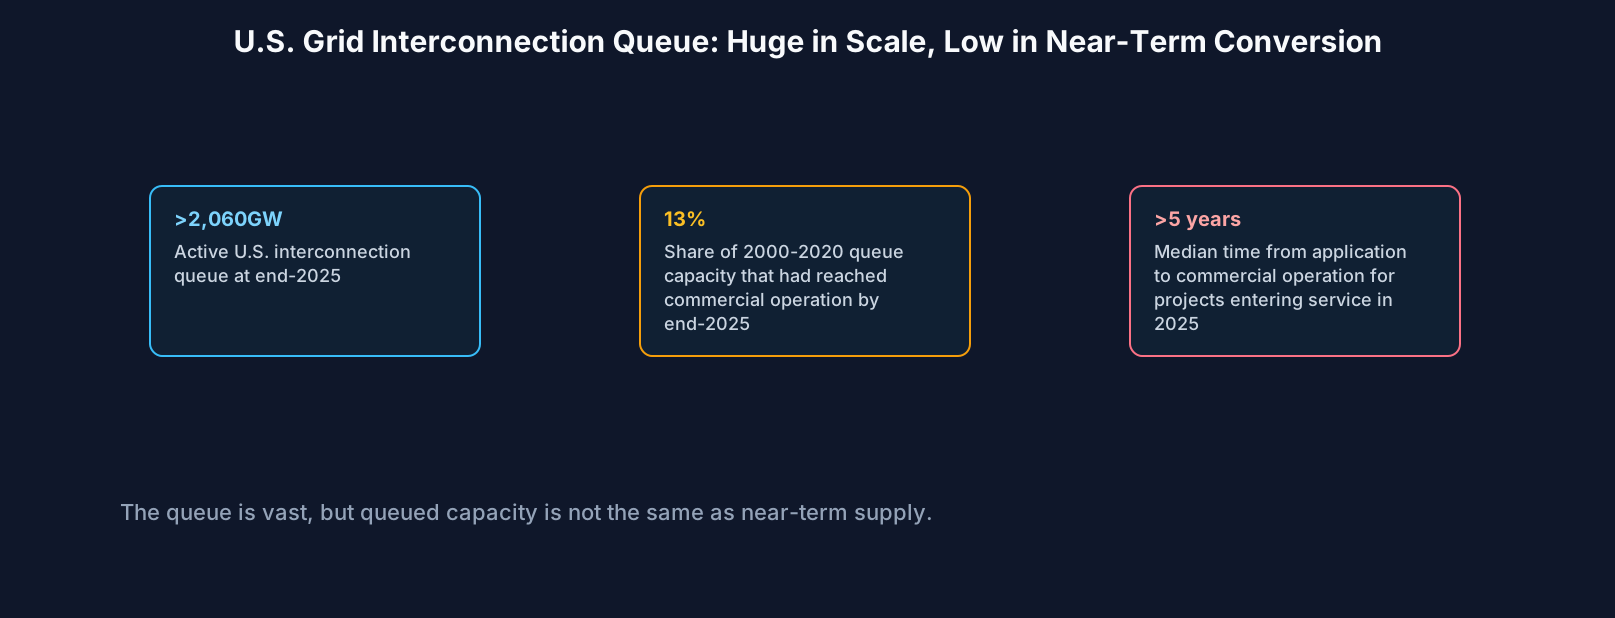
Source: Berkeley Lab, Queued Up: 2026 Edition.[3]
3.6 The Regulatory Focus Is Shifting from “Whether to Interconnect” to “Who Pays and How Load Is Dispatched”
On June 18, 2026, FERC required six regional grid operators under its jurisdiction to explain or modify their procedures for interconnecting large loads, with a focus on interconnection processes, network-upgrade cost allocation, on-site generation, demand response, and advanced transmission technologies. This action did not provide a single nationwide answer, but it marked the elevation of data center power interconnection from individual project negotiations to an issue of regional market rules.[4]
In addition to specifying the number of megawatts, power contracts must address minimum consumption commitments, security deposits, exit fees, load-curtailment rights, backup-power operating protocols, and responsibility for upgrade costs. The more specific the terms, the more closely the planned capacity disclosed in announcements reflects actual demand.