
📚 My Bookmarks
No bookmarks yet
Use the chapter navigation to jump around this report.
Uber: Core Platform Compounding Is Proven; Robotaxi Sets the Valuation Ceiling
Uber (NYSE: UBER) In-depth Equity Research Report
Analysis Date: 2026-08-10 · Data Cutoff: 2026-08-10; financials through 2026-06-30; valuation anchor as of 2026-08-05
Chapter 1: Executive Summary: Core Platform Compounding Is Proven; Robotaxi Sets the Valuation Ceiling
Maintain a "cautiously bullish / staged validation" view. The most important new evidence after Q2 is management's disclosure that some AV deployments partnered with Uber can reach roughly 25-30+ trips per vehicle per day. This suggests that demand aggregation can plausibly lift vehicle utilization. But the company has not disclosed comparable utilization versus Waymo or Tesla self-operated channels, Uber's take rate, contribution profit per mile, or capital returns. The evidence strengthens the upside case, but it is not enough to raise the fair-value center or upgrade Uber into a high-conviction core holding. [20]
Over the past year, Uber's share price fell from a high of about $102 to the $68-71 range, down roughly 30%. Core operations did not deteriorate by anything close to that magnitude. In Q2, constant-currency gross bookings grew 22%, trips grew 18%, Adjusted EBITDA grew 33%, Non-GAAP operating income grew 40%, and trailing twelve-month free cash flow exceeded $10 billion for the first time. The divergence between share price and operations shows that the market is not marking down next-quarter earnings; it is marking down Uber's terminal value and the ownership of future cash flows in the autonomous-driving era. [1][2]
The investment thesis rests on three evidence chains. First, operating compounding across Mobility, Delivery, Uber One, advertising, and Grocery & Retail has been repeatedly validated. Second, AVs may weaken the traditional driver-density network effect, but they will increase the importance of demand aggregation, peak/off-peak dispatch, fleet operations, insurance, city launches, and financing. Whether Uber can turn those capabilities into higher per-vehicle returns than AV companies can achieve by operating directly remains unproven. Third, more than $10 billion of AV capital commitments and the Delivery Hero acquisition are moving ahead at the same time, widening the gap between reported free cash flow and cash truly distributable to shareholders.
| Dimension | Latest View | Implication for the Research View |
|---|---|---|
| Core business | Operating quality continues to improve | The core business alone can support a base level of risk exposure |
| Share-price pullback | Mainly driven by AV terminal-value and capital-allocation repricing | The discount has a fundamental basis, but may overestimate the speed of damage |
| Robotaxi strategy | Early evidence exists on demand and utilization; unit economics remain undisclosed | Outcome depends on channel comparison, take rate, and capital source |
| Waymo / Tesla | Own apps and self-operated capability; Uber is not a mandatory gateway | Uber must win supply by offering higher net returns, not by relying on dependency |
| Delivery Hero | Strategically complementary, with high integration and opportunity costs | Test on cash ROIC and FCF per share, not only adjusted EPS |
| Valuation and risk exposure | About 14x reported FCF, about 17.5x FCF ex-SBC | Odds are attractive, but evidence is not strong enough for a high-conviction conclusion |
1.1 What a 7.5 Score Means for Risk/Reward
Business quality, growth runway, and operating leverage all sit around 8/10, which means the current discount is not coming from core business deterioration. What pulls down the overall score is bargaining power in the AV value chain, capital allocation, and terminal-state certainty. The current opportunity is not "the market has mispriced a risk-free company." It is "the market may be over-discounting terminal value before real risks are fully visible." This type of stock is best tracked in stages, with valuation upside adjusted as evidence arrives.
| Item | Score | Judgment |
|---|---|---|
| Business quality | 8.5 / 10 | Global scale, supply-demand dispatch, product tiering, and cross-platform sales have already formed |
| Growth runway | 8.5 / 10 | Mobility penetration, local commerce, advertising, and membership still have long runways |
| Profitability and cash flow | 8.0 / 10 | Operating leverage is clear, but reported FCF is not all distributable cash |
| Moat | 7.0 / 10 | Demand and operating systems have value, but the basic app and single-transaction switching costs are not high |
| AV strategy | 6.8 / 10 | Trips per vehicle per day provide early support; take rate, contribution profit, and capital structure remain unverified |
| Capital allocation | 5.0 / 10 | DHER and AV are advancing simultaneously, pressuring buyback priority and the asset-light profile |
| Valuation | 8.0 / 10 | Significant AV discount is already embedded; base-case returns are attractive |
| Terminal certainty | 5.5 / 10 | Leading AV companies can self-operate; platform value depends on relative economics and fragmented supply |
| Overall | 7.5 / 10 | Odds are better than certainty; suitable for medium-intensity tracking and staged validation |
Chapter 2: The Nature of the Pullback: Operating Compounding Is Intact, While Terminal Value and Capital Allocation Were Repriced
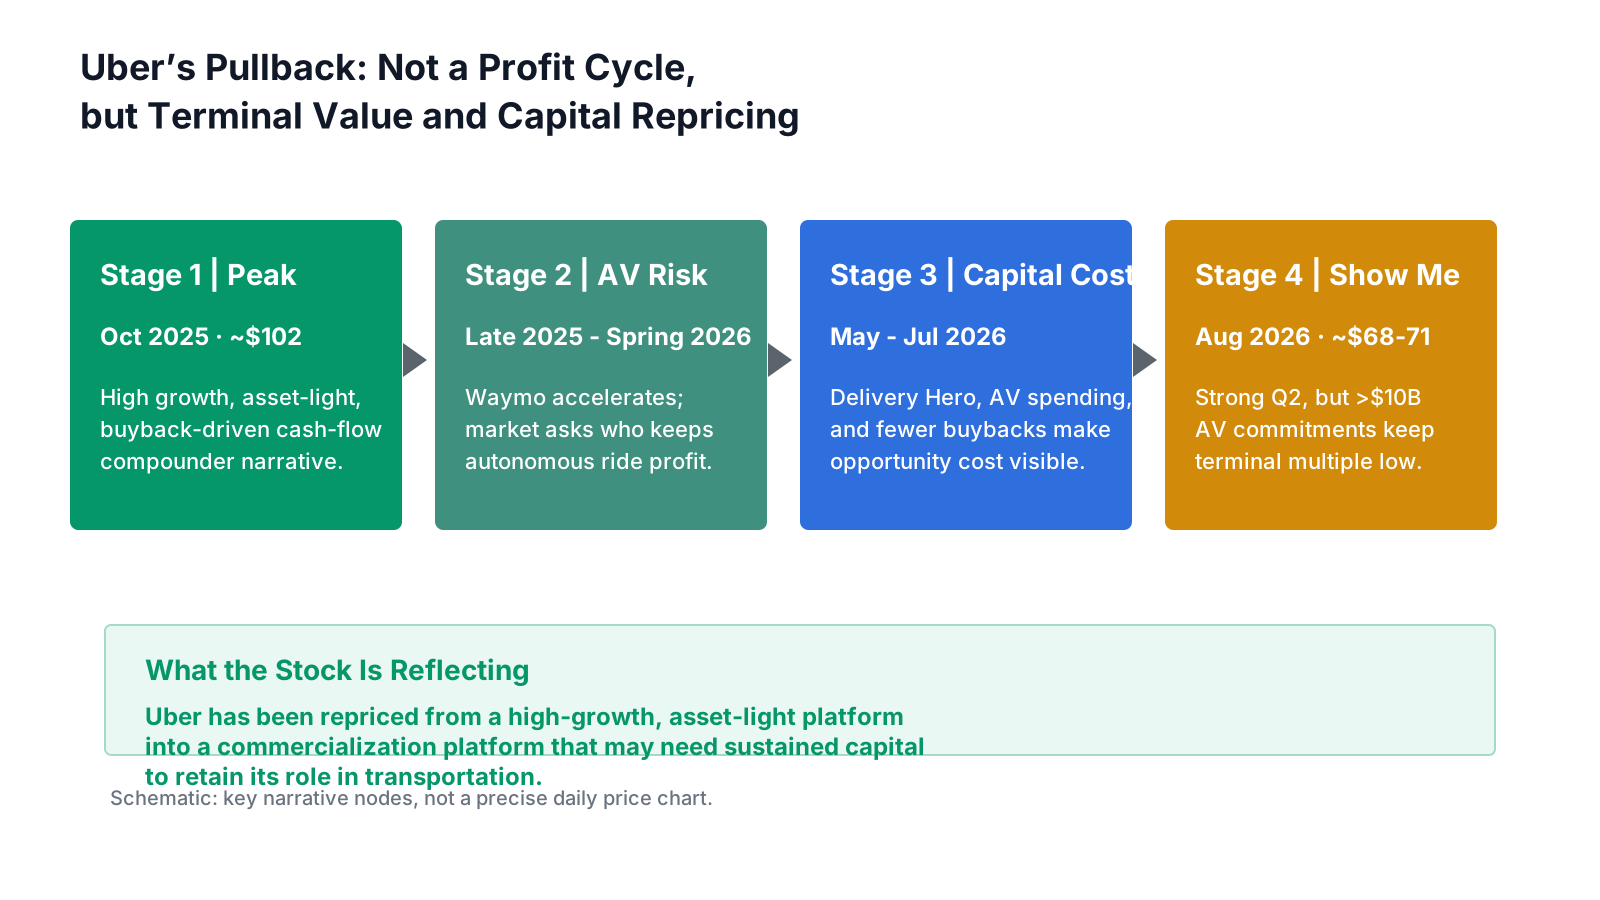
Near the 2025 high, the market treated Uber as a cash-flow machine entering harvest mode: rideshare and delivery were sustaining high-teens growth, margins were expanding, the balance sheet was improving, and buybacks were beginning to reduce share count. Then Waymo's safety data, city expansion, and order-growth pace accelerated materially. The market question shifted from "Can Uber remain profitable?" to "Once autonomous driving matures, what does Uber still control, and who owns the cash flow?" Morgan Stanley raised its Waymo forecasts while maintaining a positive rating on Uber, which shows that the threat and the valuation discount can both be real at the same time. [13]
2.1 AV Moves the Debate from Profit Growth to Value-Chain Control
The traditional rideshare supply-side network effect rests on driver density. Once AVs replace drivers, the party that controls driving software, vehicles, and asset financing may gain greater bargaining power. A bearish investor does not need to prove that Waymo or Tesla can cover the world in the near term. It is enough to prove that they can acquire customers directly in high-value cities such as San Francisco, Los Angeles, and Phoenix, retain the most profitable orders first, and leave peak or lower-margin demand to Uber. That would be enough to compress Mobility's long-term margin and terminal multiple.
There is real evidence behind this concern. As of August 10, Waymo's website labeled only Austin and Atlanta as "Ride on Uber"; several other active service cities still directed users to Waymo's own entry point. Tesla also operates an independent Robotaxi app. Goldman Sachs' scenario analysis estimates that by 2030, AVs could cannibalize about 5% of North American traditional rideshare bookings in the base case and as much as 16% in the bear case. These facts prove that bypassing Uber is technically and commercially possible. They do not yet prove that leading AV companies can fill fleets globally with higher capital returns over the long run. [14][21][22]
2.2 Capital Allocation Changed the Expected Ownership of Cash Flow
Uber is doing three things at once: investing in the core business, providing equity and seed capital to the AV ecosystem, and acquiring Delivery Hero. The market previously expected the company to focus on small bolt-on acquisitions and continued buybacks. Once a large acquisition and more than $10 billion of AV commitments appeared, investors began to worry that Uber was moving from a "cash-flow compounding platform" into a "holding and operating platform that must continuously fund the future transportation value chain."
Q2 made that concern more concrete: the company invested roughly $4 billion to build an approximately 37% economic interest in Delivery Hero, while quarterly buybacks fell to $510 million. At the same time, management announced more than $10 billion of AV equity, infrastructure, and vehicle-purchase investments or commitments over the next several years. The market therefore started valuing Uber on "cash flow distributable to shareholders" rather than reported free cash flow. [2][8]
2.3 Short-term Growth Volatility Is Not the Main Issue
Third-party app data had shown slower growth in rider and driver MAUs. Weather, geopolitical conflict, fuel support, insurance costs, and reinvestment through lower prices also pressured near-term estimate revisions. These factors explain part of the volatility, but they do not explain why the stock stayed weak after a strong Q2. Official Q2 MAPC, trips, bookings, and operating profit all kept growing at high rates, which indicates that the market is really repricing long-term profit distribution, not a current-business recession. [10][11]
| Explanation Factor | This Report's Weight | What the Market Is Really Worried About |
|---|---|---|
| AV terminal value and bypass risk | 45%-55% | Whether leading vertical operators take high-value cities, consumer entry points, and pricing power |
| Capital allocation and asset-light shift | 25%-30% | Whether AV and DHER permanently reduce ROIC, buybacks, and per-share cash flow |
| Growth, margins, and guidance | 15%-20% | Whether lower prices, insurance, fuel, tax rates, and reinvestment slow profit compounding |
| Macro, regulation, and other factors | 5%-10% | Driver classification, delivery fees, geopolitical conflict, and risk appetite |
Note: This is an explanatory attribution, not a strict event study. It is meant to separate what the stock is trading on, not mechanically allocate every daily move.